Best Practice for Continuous Particle Monitoring in Pharmaceutical Clean Rooms
Abstract
Presentation touches the most common user questions regarding interpretation of Annex 1:
•Monitoring frequencies
•Sample volumes for monitoring
•Clean up period
•Particle loss in tubing
•Sample points via risk analysis
•How to define limits
2
Documents to be discussed
CLEAN ROOM AND CLEAN AIR DEVICE CLASSIFICATION
“The maximum permitted airborne concentration for each grade is given in the following table:”
|
Max. Particle Concentration (per m3) |
|
|
||
|
|
|
|
||
|
AT REST |
|
IN OPERATION |
||
Grades |
≥ 0,5 μm |
≥ 5,0 μm |
|
≥ 0,5 μm |
≥ 5,0 μm |
|
|
|
|
|
|
A |
3.520 |
20 (ISO 4,8) |
|
3.520 |
20 |
|
|
|
|
|
|
B |
3.520 |
29 |
|
352.000 |
2.900 |
|
|
|
|
|
|
C |
352.000 |
2.900 |
|
3.520.000 |
29.000 |
|
|
|
|
|
|
D |
3.520.000 |
29.000 |
|
nA |
nA |
|
|
|
|
|
|
These limits apply for clean room classification.
They do not automatically apply for monitoring sample points. Monitoring “limits” will be discussed later.
MICROBIAL MONITORING
|
limits for microbial contamination (a) |
||
|
Volumetric |
Settling plates |
Contact plates |
|
sampling |
(D= 90 mm) |
(D= 55 mm) |
|
(cfu/m3) |
cfu / 4 hr (b) |
cfu / plate |
Grades |
|
|
|
|
|
|
|
A |
< 1 |
< 1 |
< 1 |
|
|
|
|
B |
10 |
5 |
5 |
|
|
|
|
C |
100 |
10 |
25 |
|
|
|
|
D |
200 |
100 |
50 |
|
|
|
|
(a)Average values
(b)Individual settling plates < 4 hrs
CLEAN ROOM …... MONITORING
In Grade A areas monitoring is mandatory
“For grade A zones, particle monitoring should be undertaken for the full duration of critical processing …...”
Getting a complete picture is mandatory too
“Grade A zones should be monitored at a frequency and with suitable sample size that all interventions, transient events, and any system deterioration can be captured”
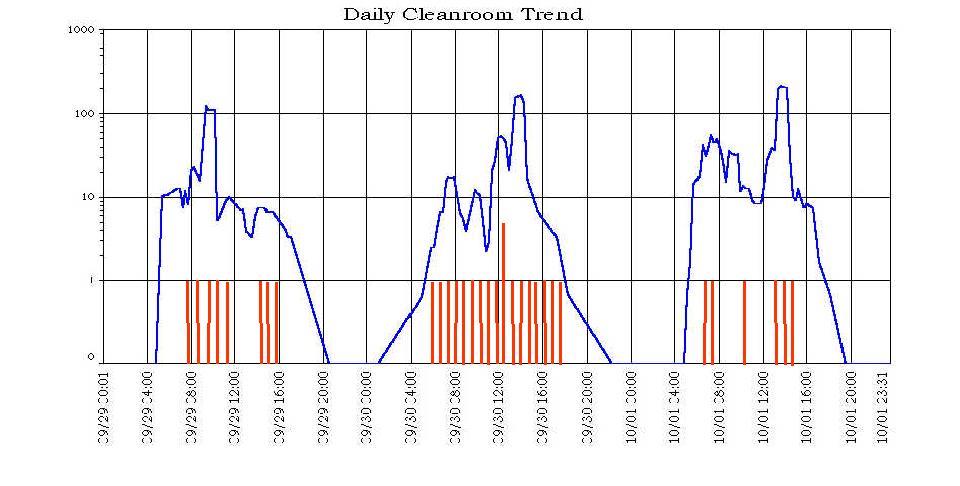
Example - 48 hrs ≥ 0,5 um data - A area
#1
#2
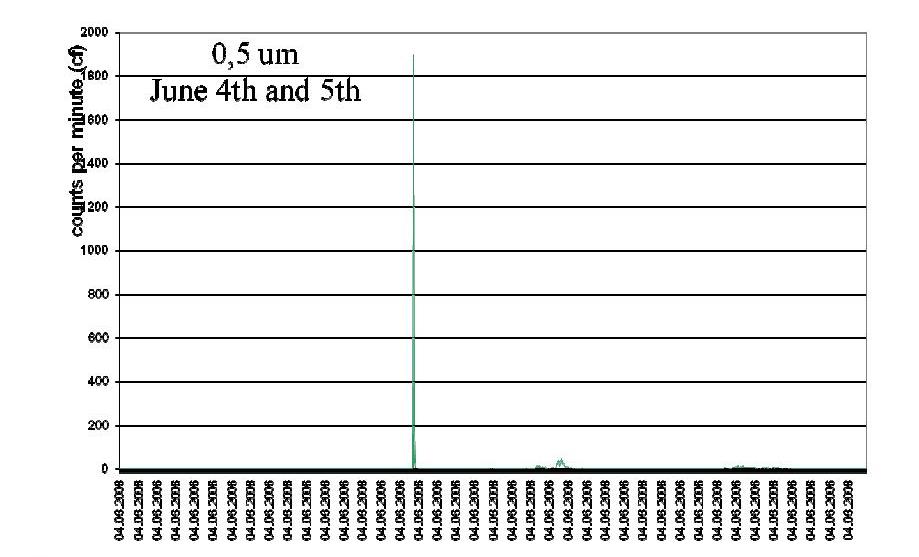
Catching the transient events – example # 1
Total event covers 2298 counts
Measurement over 35 minute would give 2298 counts/m3
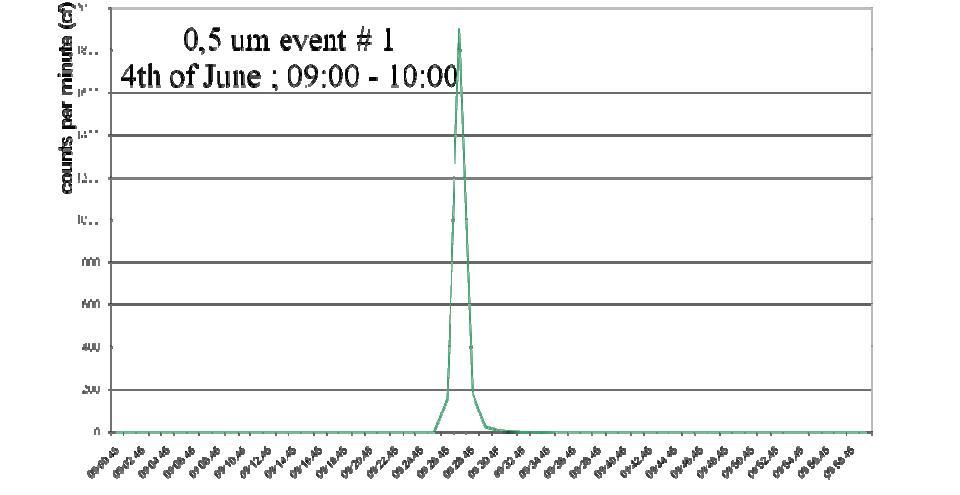
Analysing the ≥ 0,5 um events – example # 2
CLEAN ROOM …... MONITORING
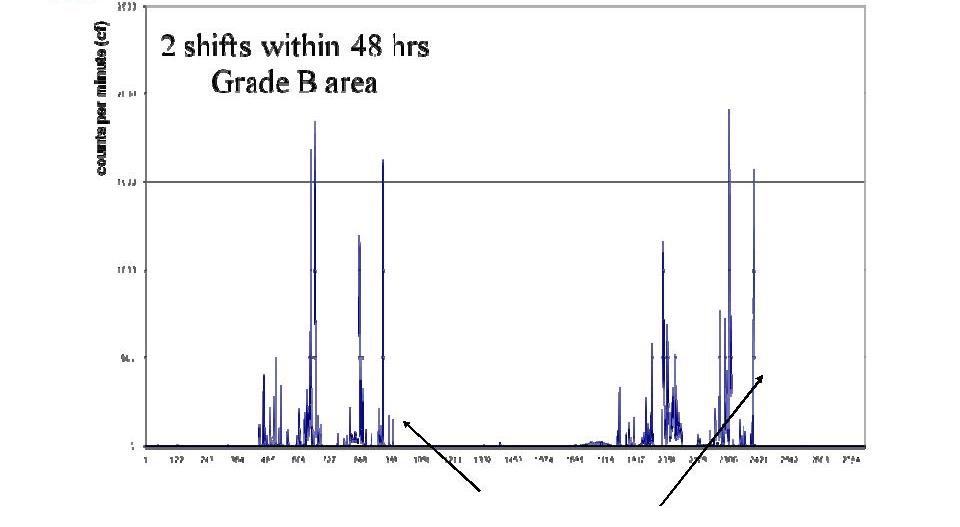
It is recommended that a similar system be used for Grade B zones although the sample frequency may be decreased. The importance of the particle monitoring system should be determined by the effectiveness of the segregation between the adjacent Grade A and B zones.
The Grade B zone should be monitored at such a frequency and with suitable sample size that changes in levels of contamination and any system deterioration would be captured and alarms triggered if alert limits are exceeded
The monitoring of Grade C and D areas in operation should be performed in accordance with the principles of quality risk management
CLEAN ROOM …... MONITORING
1 m3 sampling is NOT suitable for monitoring
“The sample size ......using automated system will be a function of the sampling rate of the instrument used.
It is not necessary for the sample volume to be same as that used for formal classification of cleanroom and clean air devices”
CLEAN ROOM …... MONITORING
“In Grade A and B zones, the monitoring of the ≥5.0 μm particle concentration count takes on a particular significance as it is an important diagnostic tool for early detection of failure“
Comment lecturer:
Even moresoe the ≥ 0,5 um data – due to the better statistical significance
“The particle limits given in the table for the at rest state should be achieved after a short clean up period of
Clean up period ≥ 0,5 um events
At rest values after 20 Min clean up phase
Bad practice
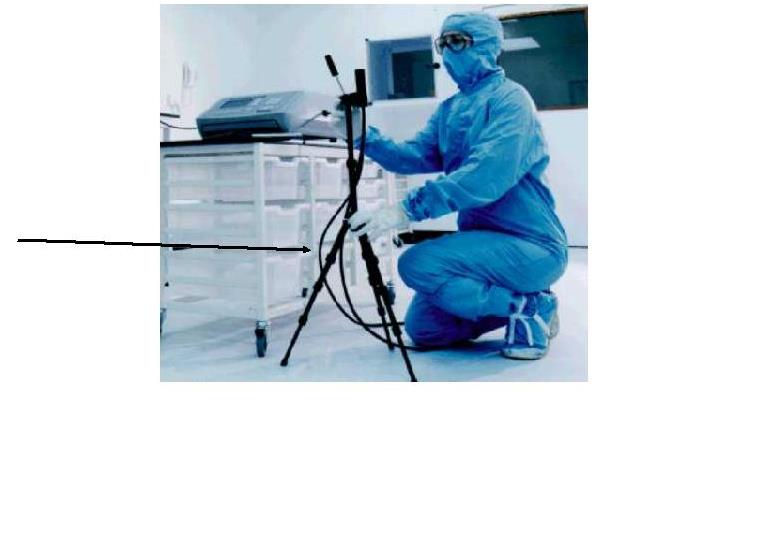
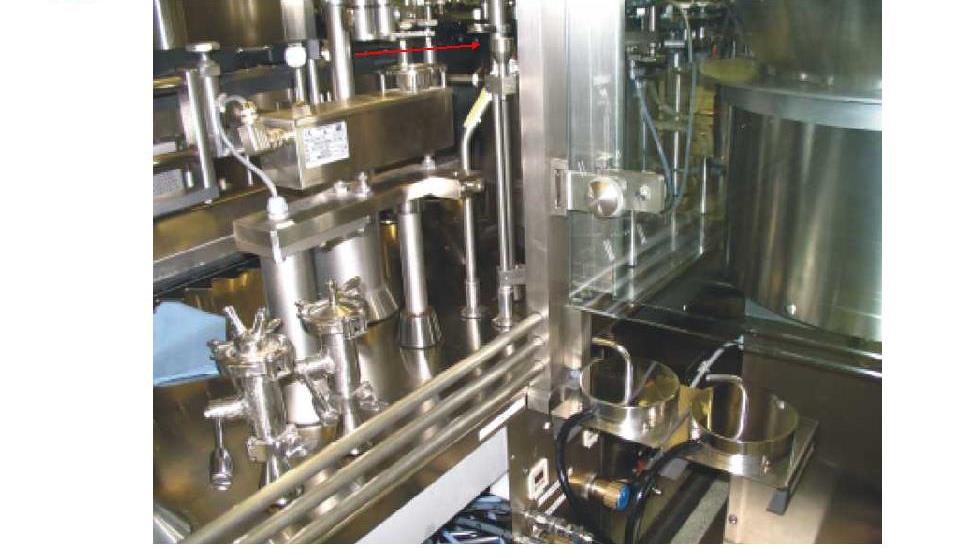
“Portable particle counters with a short length of sample tubing should be used….because of the relatively higher rate of precipitation of particles ≥ 5 um in remote sampling systems with long lengths of tubing”
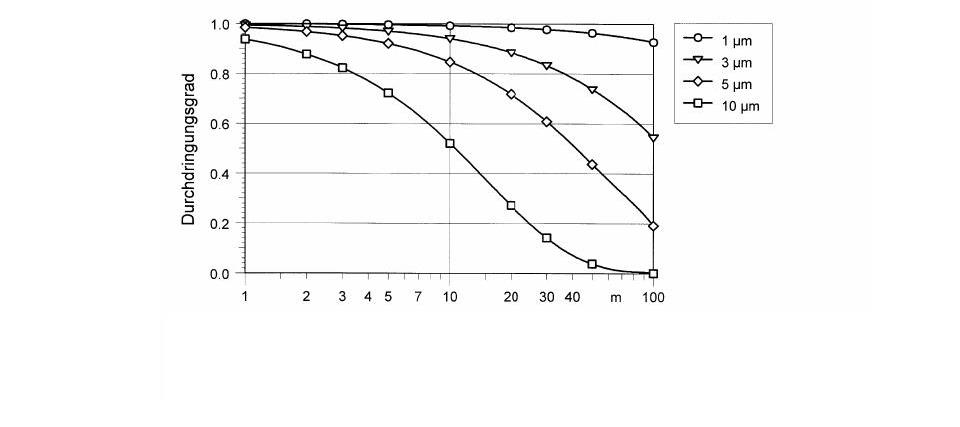
Particle losses – theoretical data
Horizontal tube
1cm inner diameter // 28,3 l/min flow
15
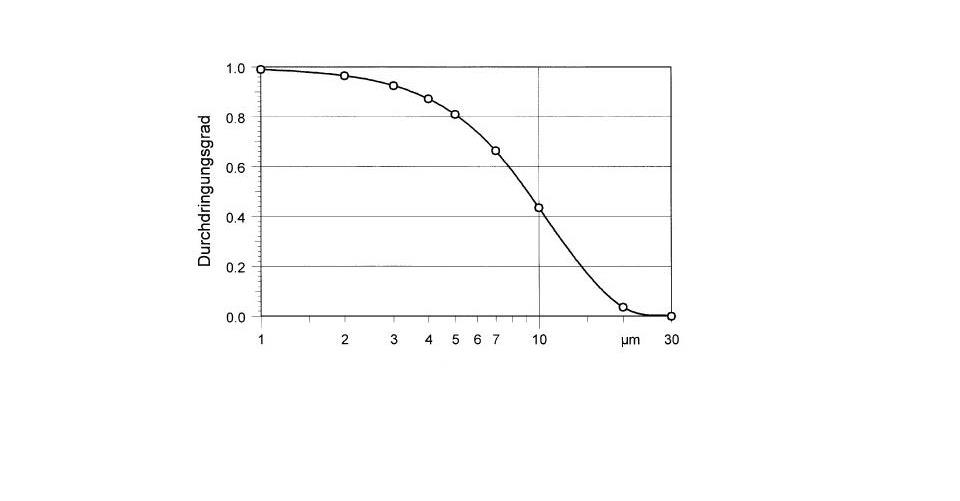
Particle losses – theoretical data
Loss per 900 elbow
1cm inner diameter // 28,3 l/min flow // density 1 g/cm3
16
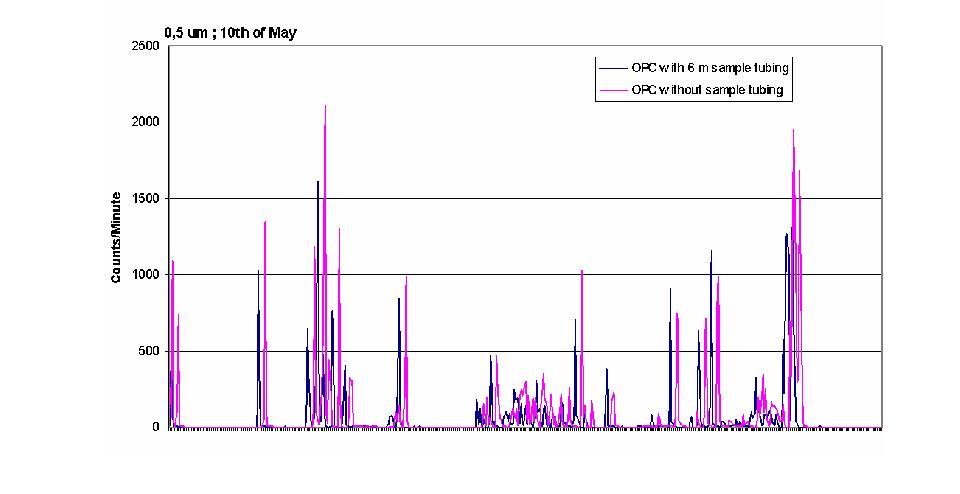
Loss of ≥ 0,5 um particles - real data - D area
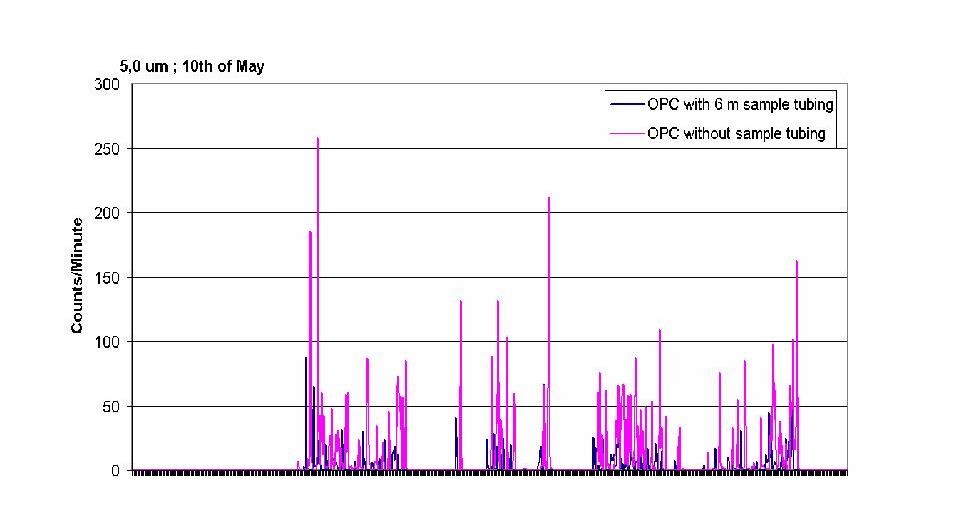
Loss of ≥ 5,0 um particles - real data - D area
CLEAN ROOM…….MONITORING
“Clean rooms and clean air devices should be routinely monitored in operation“
and
“the monitoring locations based on a formal risk analysis study and the results obtained during the classification of
rooms and/or clean air devices“
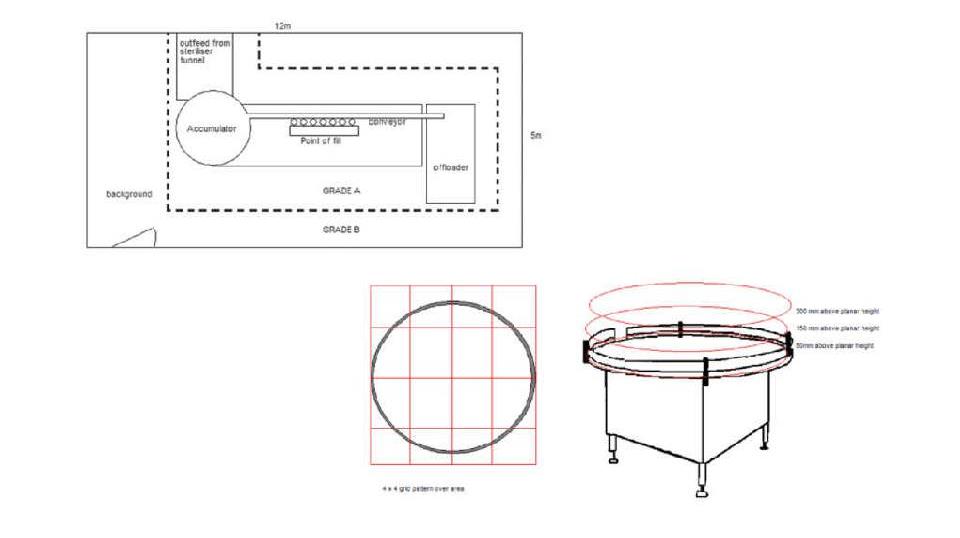
Risk analysis
Drawings in chapter “risk analysis“ provided by M. Hallworth/ Particle Measuring Systems Inc
Risk analysis – step 1
Risk analysis – step 2
CLEAN ROOM …... MONITORING
“For Grade A zones, particle monitoring should be undertaken for the full duration of critical processing, including equipment assembly, “
except
“where justified by contaminants in the process that would damage the particle counter or present a hazard, e.g. live organisms and radiological hazards. In such cases monitoring during routine equipment set up operations should be undertaken prior to exposure to the risk.”
CLEAN ROOM …... MONITORING
“It is accepted that it may not always be possible to demonstrate low levels of ≥ 5,0 μm particles during filling operations due to the generation of particles or droplets from the product itself”
24
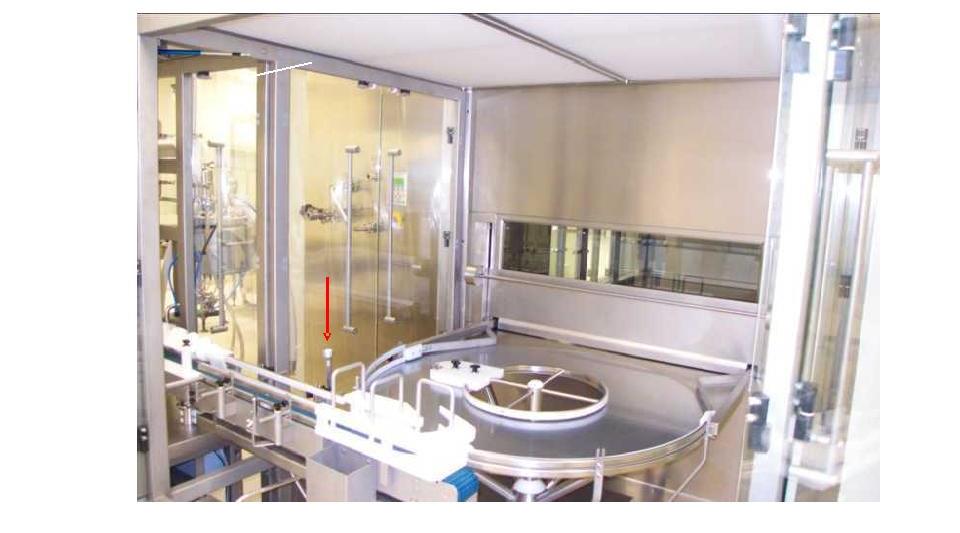
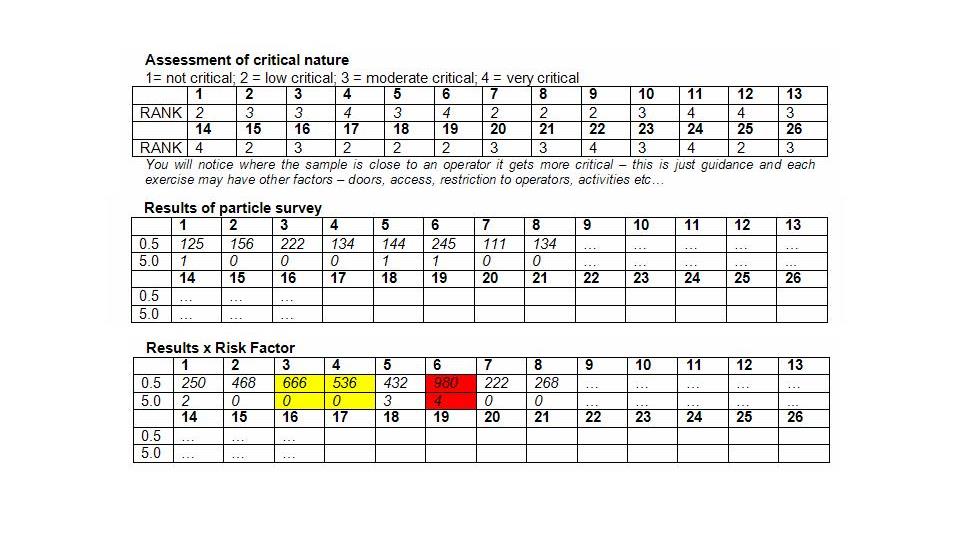
Sample points as result of risk analysis
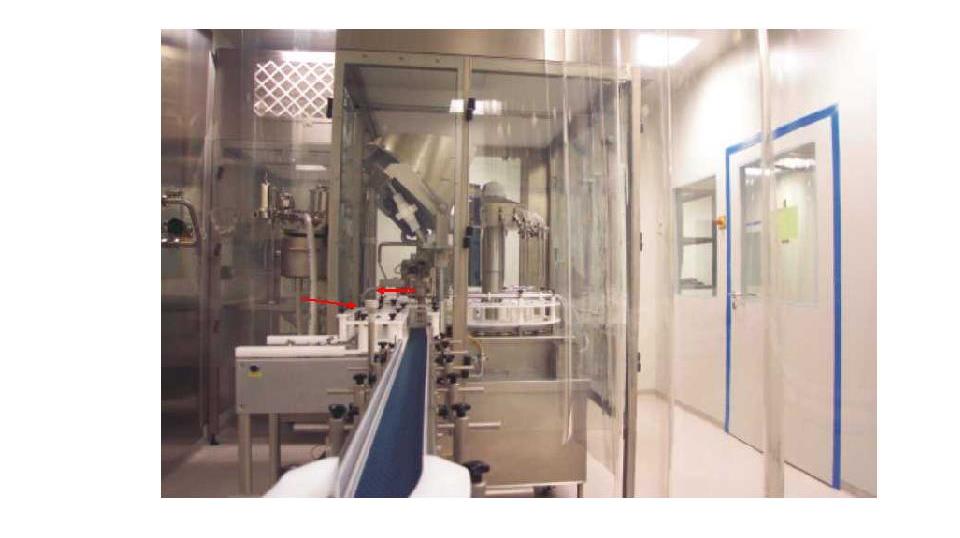
Sample points as result of risk analysis
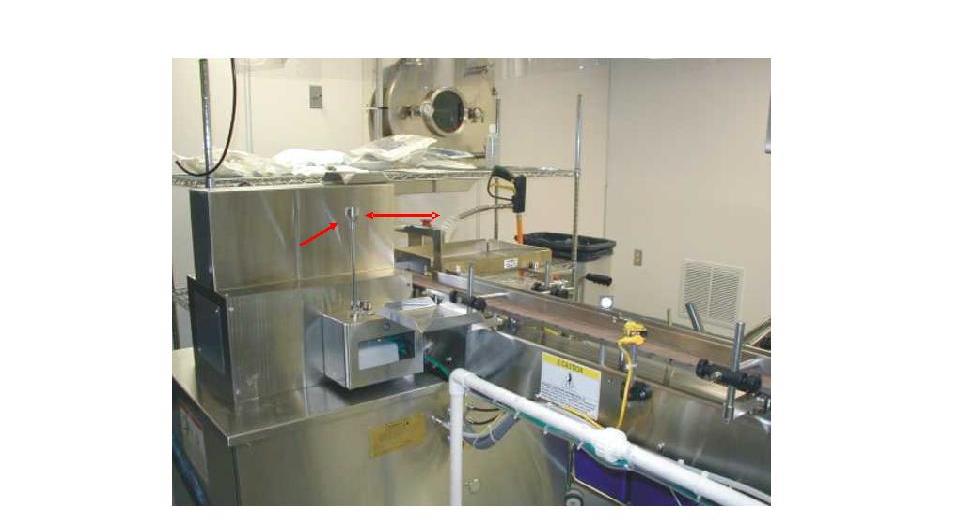
Sample points as result of risk analysis
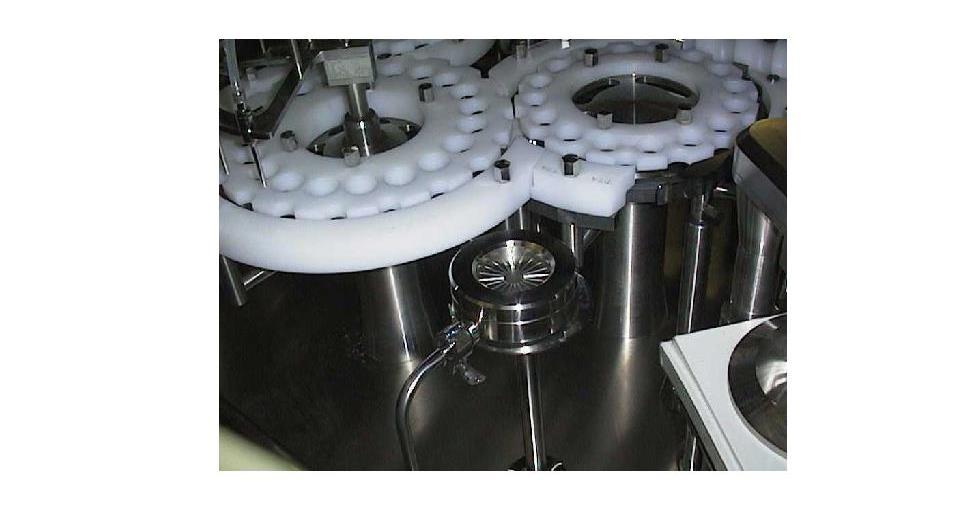
Sample points as result of risk analysis
Sample points as result of risk analysis
Alert and action limits
“Appropriate alert and action limits should be set for the results of particulate and microbiological monitoring.
If these limits are exceeded operating procedures should prescribe corrective action“
Alert and action limits ≥ 0,5 um
31
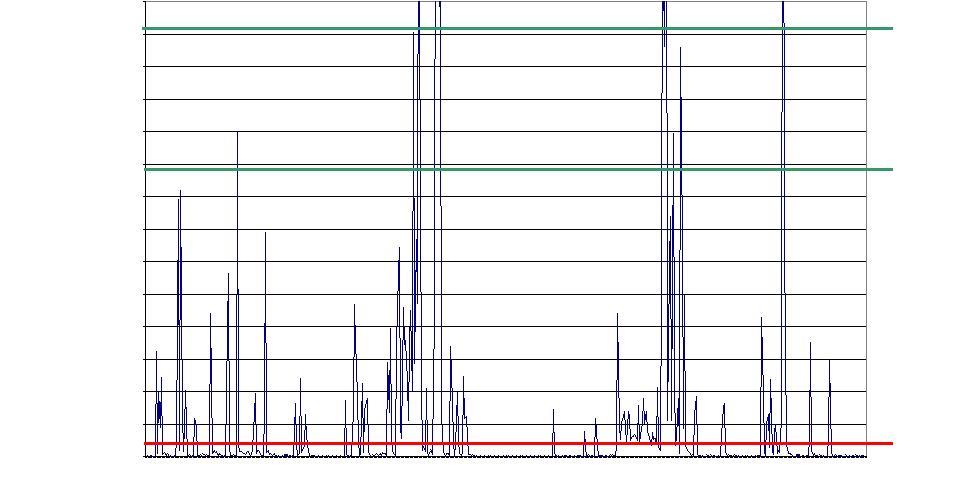
Alert and action limits ≥ 0,5 um
700 |
|
|
|
|
|
|
|
|
|
|
|
|
|
|
|
|
|
|
|
|
|
|
|
|
|
|
|
|
|
|
|
|
650 |
|
|
|
|
|
|
|
|
|
|
|
|
|
|
|
|
|
|
|
|
|
|
|
|
|
|
|
|
|
|
|
|
600 |
|
|
|
|
|
|
|
|
|
|
|
|
|
|
|
|
|
|
|
|
|
|
|
|
|
|
|
|
|
|
|
|
550 |
|
|
|
|
|
|
|
|
|
|
|
|
|
|
|
|
Use 2 X SD |
|
|
|
|
|
|
|
|
|
|
|
|
|||
|
|
|
|
|
|
|
|
|
|
|
|
|
|
|
|
|
|
|
|
|
|
|
|
|
|
|
|
|
||||
500 |
|
|
|
|
|
|
|
|
|
|
|
|
|
|
|
|
or |
|
|
|
|
|
|
|
|
|
|
|
|
|
|
|
|
|
|
|
|
|
|
|
|
|
|
|
|
|
|
|
|
|
|
|
|
|
|
|
|
|
|
|
|
|
|
||
450 |
|
|
|
|
|
|
|
|
|
|
|
|
|
|
|
|
3 X SD |
|
|
|
|
|
|
|
|
|
|
|
|
|
||
400 |
|
|
|
|
|
|
|
|
|
|
|
|
|
|
|
|
|
|
|
|
|
|
|
|
|
|
|
|
|
|
|
|
350 |
|
|
|
|
|
|
|
|
|
|
|
|
|
|
|
|
|
|
|
|
|
|
|
|
|
|
|
|
|
|
|
|
300 |
|
|
|
|
|
|
|
|
|
|
|
|
|
|
|
|
|
|
|
|
|
|
|
|
|
|
|
|
|
|
|
|
250 |
|
|
|
|
|
|
|
|
|
|
|
|
|
|
|
|
|
|
|
|
|
|
|
|
|
|
|
|
|
|
|
|
200 |
|
|
|
|
|
|
|
|
|
|
|
|
|
|
|
|
|
|
|
|
|
|
|
|
|
|
|
|
|
|
|
|
150 |
|
|
|
|
|
|
|
|
|
|
|
|
|
|
|
|
|
|
|
|
|
|
|
|
|
|
|
|
|
|
|
|
100 |
|
|
|
|
|
|
|
|
|
|
|
|
|
|
|
|
|
|
|
|
|
|
|
|
|
|
|
|
|
|
|
|
50 |
|
|
|
|
|
|
|
|
|
|
|
|
|
|
|
|
|
|
|
|
|
|
|
|
|
|
|
|
|
|
|
|
0 |
|
|
|
|
|
|
|
|
|
|
|
|
|
|
|
|
|
|
|
|
|
|
|
|
|
|
|
|
|
|
|
|
1 |
18 |
35 |
52 |
69 |
86 |
103 |
120 |
137 |
154 |
171 |
188 |
205 |
222 |
239 |
256 |
273 |
290 |
307 |
324 |
341 |
358 |
375 |
392 |
409 |
426 |
443 |
460 |
477 |
494 |
511 |
528 |
545 |
32
Alert and action limits
For ≥ 0,5 um particle data (with good statistical significance):
A 95% confidence limit should be established for the actual events during production.
Data can be achieved during media fills while operators are following SOPs in ‘normal’ operations.
The limits found may be less than the class limits
33
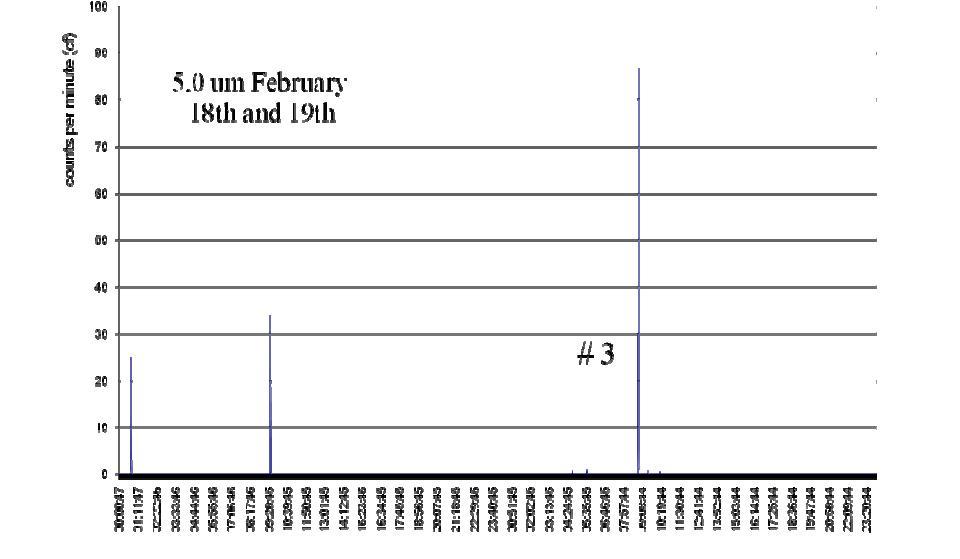
Alert and action limits ≥ 5,0 um
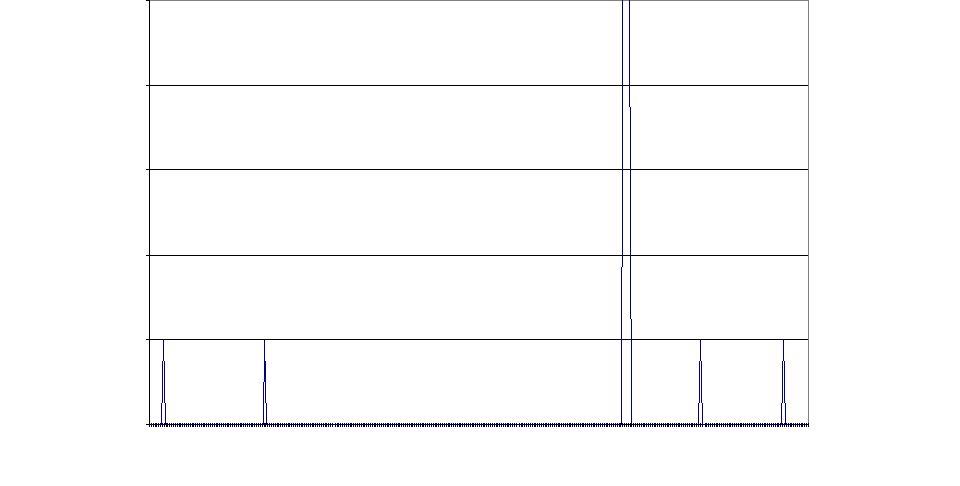
Alert and action limits ≥ 5,0 um
5
4
Event series
# 3
3
2
1
0
1 |
12 |
23 |
34 |
45 |
56 |
67 |
78 |
89 |
100 |
111 |
122 |
133 |
144 |
155 |
166 |
177 |
188 |
199 |
210 |
221 232 243 254 |
265 276 287 |
298 309 320 |
331 342 353 |
|
|
|
|
|
|
|
|
|
|
|
|
|
|
|
|
|
|
|
|
|
|
|
|
|
|
|
|
|
|
|
|
|
|
|
|
|
|
|
|
|
|
|
|
|
|
|
|
Alert and action limits
N:m = 3:10
Where t= 1 min
Drawing provided by M. Hallworth/ Particle Measuring Systems Inc
36
Alert and action limits
For ≥ 5.0 µm particle data (with poor statistical significance):
A number of events per unit time should be used. Frequency has been estimated to be no more than 3 events in
any 10 minutes to create an action (n:m = 3:10; 3rd event rule) and potentially 2:10 events for an alert.
Values are 0 or 1 and (even though it is unusual statistics) “standard deviation” is 1
One event with 3 counts will lead into an alert; one event with 4 counts causes actions
