Application example of a combined FTA and FMEA
|
This section addresses the following questions:
|
The following example demonstrates how the QM process of change management can be systematically analysed and its risks identified. The example includes only an example of the actual process and the subsequent assessments. Neither the content nor the evaluation of the identified risks correspond to reality. The example is used to describe a systematic sequence of process description, risk identification and risk assessment, through to the definition and evaluation of preventive measures. It also demonstrates how this method can be used to trace the acceptance of residual risk.
This example clearly demonstrates that it is not necessary, and may even be a hindrance, to use highly standardised risk tools such as described in standard works.
The investigation was carried out in response to the demand for an evaluation of the safety and stability of the change management process in the pharmaceutical production area.
1 Step 1: team formation and working method
In order to ensure that all important aspects were considered, a core team was formed that comprised experts from the areas of CMC compliance, logistics, regulatory affairs and IT application support. A moderator or coach was responsible for the systematic implementation of the methods. The usual moderation tools are available as technical processing aids. The use of a computer for presentations on a screen has proved to be a useful tool.
2 Step 2: discussion of the process and
identification of the risk
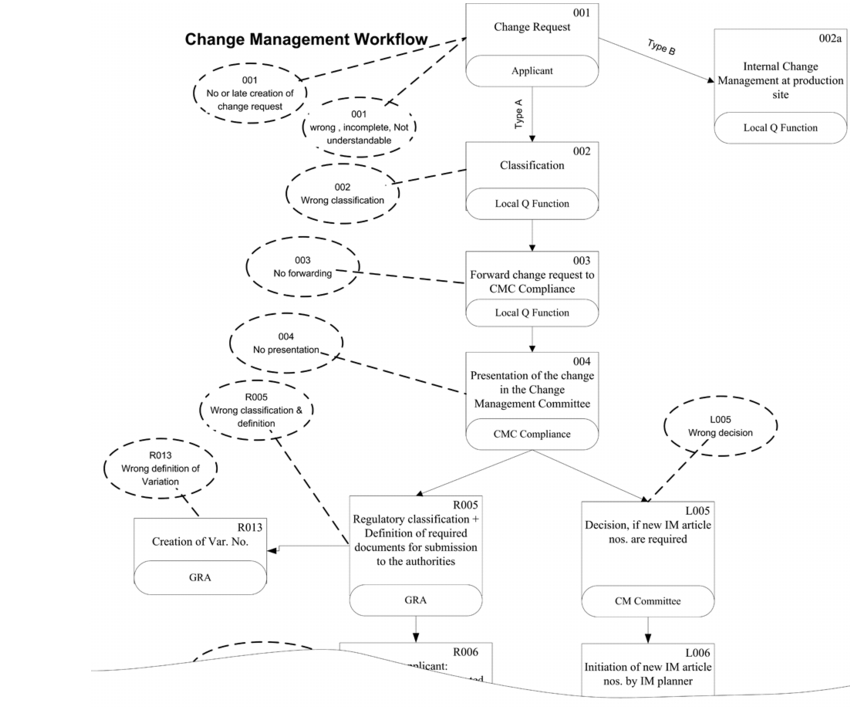 |
In order to identify risks and their causes, the process described in detail in figure 1 and it associated functions were examined for possible risks. For purposes of orientation, the potential risks have already been outlined in the process flow diagram. The risks were then transferred to a modified FTA. The risks were then investigated in detail to analyse their causes and consequences. .
 |
For this example, two "top events" emerge as consequences:
- A product that has not yet received marketing authorisation from the local authorities reaches a market. The risk for the patients in terms of effects and side effects must be classified as high.
- Delayed marketing authorisation of a product may lead to an out-of-stock situation. This may result in patients being unable to receive treatment with a certain drug product.
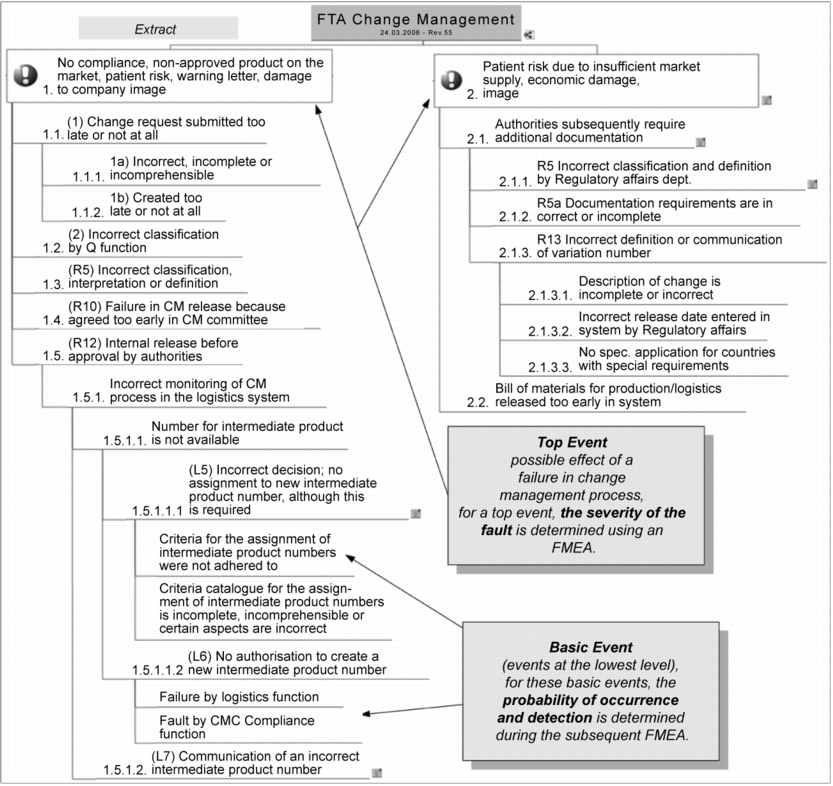
Starting from these top events and the risks that have already been determined, the causal relationships are now examined with the repeated question of "What causes the onset of the event?" (question of why). The result of this questioning strategy leads to a tree structure with the top events at the highest level and the basic events at the "roots" of the tree, as shown in figure 2. In this analysis, unlike the classic FTA, no AND or OR gates are used (see chapter 1.8 Fault Tree Analysis (FTA)), because only the OR case is relevant here. This means that no situations were identified in which two events must occur at the same time ("&") in order for the top event to take place. The identification and analysis of the risks with the classification from top event to basic event was supported by a very effective mindmapping method. This method considerably facilitates the creation and positioning of the resulting causal branches during the discussion.
3 Step 3: risk evaluation and acceptance
|
S Failure severity |
O Probability of occurrence |
D Probability of detection |
Evaluation |
|---|---|---|---|
|
No adverse effects on product quality can be derived. |
Based on a great deal of experience, this failure is not expected. |
High: 100 % automated check coupled with an alarm system. Or: functional failure that will almost certainly be noticed in subsequent operations. |
1 |
|
The failure has effects on technical processes, but no effect on product quality. |
Very rare: occurrence cannot be absolutely excluded. |
Medium: 100 % check, various testing mechanisms, e.g. monitoring of process parameters with alarm system. Or: obvious failures that will very probably be noticed in subsequent operations. |
2 |
|
Minor deviations from the product specification may occur, which require the implementation of moderate measures (e.g. higher monitoring frequency in final testing, additional test scope). |
Rare: the failure occurs at irregular intervals and rarely. |
Low: Or: easy to identify failure that is monitored |
3 |
|
Severe deviations in product quality may occur, which require strict measures (e.g. rejection of batch, recall of products). |
Moderate: the failure occurs repeatedly. Or: there is no prior experience with the product. |
Very low: Or: defect characteristic that is not easily detected |
4 |
|
Deviations may occur that could cause damage to consumers. |
High: the failure occurs frequently. The trend is increasing. Or: it is almost definite that failures will occur on a large scale. |
Improbable: |
5 |
For the evaluation, a modified FMEA was used (see chapter 1.9 Failure Mode Effects Analysis (FMEA)). In the case described here, the circumstances discussed lead to two possible failure consequences at the highest level. To produce the RPN, values for failure severity must therefore only be determined for these two top events. Figure 3 shows an overview of the evaluation factors and their significance for failure severity (S), probability of occurrence (O), and probability of detection (D).
In this case the factor 4 for failure severity was chosen for the first top event, and factor 3 for the second top event.
The probability of occurrence and probability of detection are only evaluated for the basic events, i.e. only for the events at the lowest level (see figure 4). When one of these basic events occurs and the failure is not detected, it "penetrates" directly through to the top event.
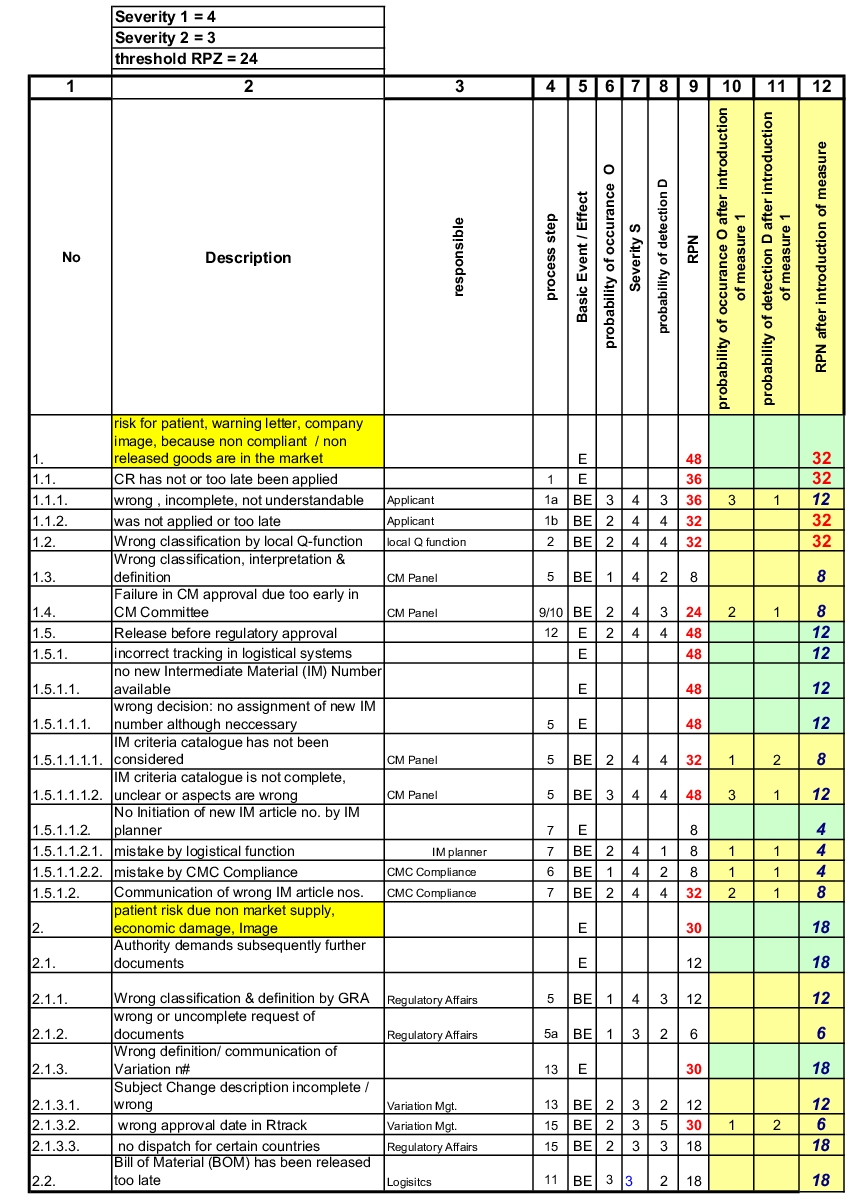 |
It is now easy to realise that the factors O and D only need to be allocated individually for the Basic Events (BE) (column 6,8). Multiplying factor S (column 7) for failure severity of the top events, results in the 
to enlarge, click here! risk priority number RPN for each basic event (column 9).
The question was discussed of which RPN value assigned to each individual risk is still deemed acceptable. An RPN of 24 (threshold) was defined as an acceptance limit, and thus for all risks that exceed this value, measures must be found, which significantly increase either the probability of occurrence (O) or the probability of detection (D). Risks below this value are accepted.
4 Step 4: risk control
In the course of the discussion on risk control, the implementation of a computerised information system to increase the transparency of the overall process was investigated as a risk-minimising measure. The effective implementation of this system, including training and user instruction, enabled a reduction in RPN to values below the defined threshold for five out of seven risks. Columns 10 to 12 show the evaluation of the risks after implementation of this measure.
Figure 5 shows another example for describing the effects of certain risk-minimising measures.
|
|
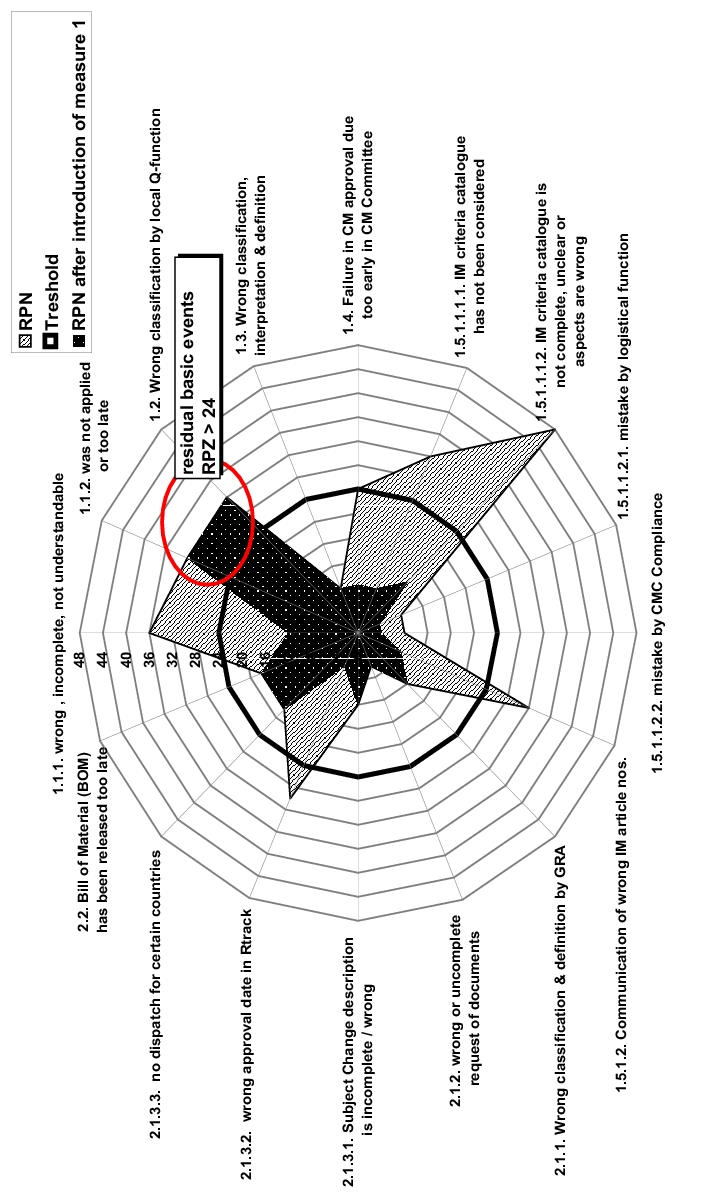
5 Step 5: further measures and verification
In the next step, measures now need to be identified for reducing the residual risks with an RPN that is still above the defined threshold. After determination and implementation of measures, their success must then be critically monitored (risk review). For example, a review can be carried out at regular intervals that results in adaptations to the risk evaluation or measure definition. This type of review can lead to the realisation that some risks were assessed too critically in the initial evaluation, and measures can be consequently dispensed with or they can be implemented to a lesser extent.
|
Summary The application of a fault tree analysis (FTA) enables you to list the causes of failures (top events) down to the basic events. In a subsequent FMEA, the failure severity is only established for the top events. The probability of occurrence and probability of detection is only established for the basic events, since a failure that is not detected has a direct effect on the top event. Measures implemented for risk control can lead to a considerable reduction of the RPN in a variety of cases. |
