Fault tree analysis (FTA)
|
This section addresses the following questions:
|
1 Objectives and areas of application
The FTA (fault tree analysis) methodology originates in the electrical industry and is described in detail in the international standard CEI IEC 61025 and in DIN 25424. The standard is often used in technical areas, but can be generally applied in any situation where the possible causes of a particular fault behaviour, e.g. system downtime, need to be systematically identified and documented. The method is generally suitable for both prospective and retrospective analysis.
Fault tree analyses can possess a high level of information content, which can also be made available to other areas for information and exchange of experiences. For example, the questions and answers produced in similar facilities relating to possible causes of impurities in a product can be compared.
The procedure can be used to identify the similarities and thus the actual cause of a fault. The FTA can be used in the investigation of complaints or deviations in order to improve the actual causes of a fault and ensure that the intended improvements will actually solve the problem and not simply lead to new problems. The fault tree analysis is ideally suited for analysing the impact of several factors on a particular problem. The result of an FTA includes a visual representation of the types of faults and a quantitative estimation of the probability of the individual types of error. The FTA is suitable for risk assessment and for the development of monitoring programs.
2 Process
Starting from an event (faulty behaviour/breakdown), the possible causes are identified (see figure 1).
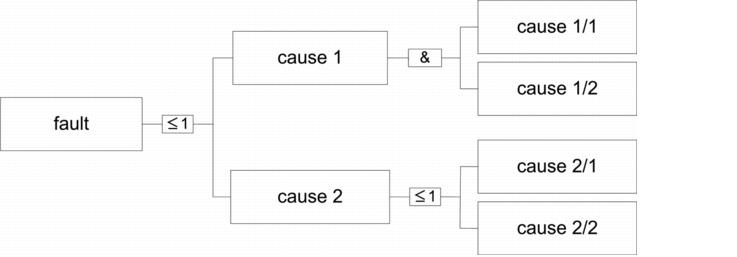 |
For each established cause, in turn the cause is determined, until no more answers can be found. This method results in a fault tree with a varying number of levels and nodes depending on its complexity. One event can have one or more causes and is described by the gate symbols "?1" and "&". In general, the FTA starts with a node without a top event. At the end of each branch, the basic event is specified; this is a node to which no further nodes are connected.
It is only practical to create an FTA if you want to analyse and visualise more complex correlations, e.g. technical systems, QM processes, or production processes. For example, the analysis of why the microbiological status of a purified water plant cannot be maintained at safe levels, leads to a wide variety of causes.
The FTA can also be used together with an FMEA to establish preventative measures. The FTA provides clear and traceable documentation of the analyses and is therefore also well suited to validation.
The result of an FTA therefore supplies an extremely systematic overview of possible causes and their interrelations. It provides a good basis for an FMEA. The results of an FTA can be used to deduce measures for the reduction of GMP risks.
3 Prerequisites for an FTA
In order for an FTA to be applied successfully, it is necessary to have an exact knowledge of the processes of the system when it is functioning under normal conditions. The following prerequisites must be fulfilled:
- Sufficiently detailed system and process descriptions must be available.
- Product specifications must be available.
- Documentation that may already provide an indication as to the cause of failure (e.g. annual product reviews, log books, out-of-specification results (product does not achieve the specified quality), maintenance logs) should be available.
The FTA team should include members from subject areas who might be able to contribute to the solution of the problem. A team leader is responsible for the coordination. A method specialist guides the team through the FTA process.
4 Execution of an FTA
The FTA also requires a systematic procedure. The following steps are recommended:
 |
Step 1:
A system analysis is performed, with which the "method of action of the system under consideration of its interfaces should be made transparent".
Step 2:
The undesirable event and the fault criteria are defined. For example, an out-of-specification result in manufacturing is the unwanted event. A fault criterion is a deviation from the specification for a particular test point, and its cause.
Step 3:
Reliability variables are determined. This information is a prerequisite for the quantitative evaluation of a fault tree. However, this type of data is not often available. Reliability data is sometimes (e.g. for measurement and control instruments) determined by the manufacturer (specification such as a reliability rate = 99.2 %).
Step 4:
A distinction is made between the different types of causes:
- Technical fault behaviour under reliable conditions or unacceptable external factors
- Human operating error or misuse
- Uncharacteristic physical/chemical behaviour
- External factors
- Other
Step 5:
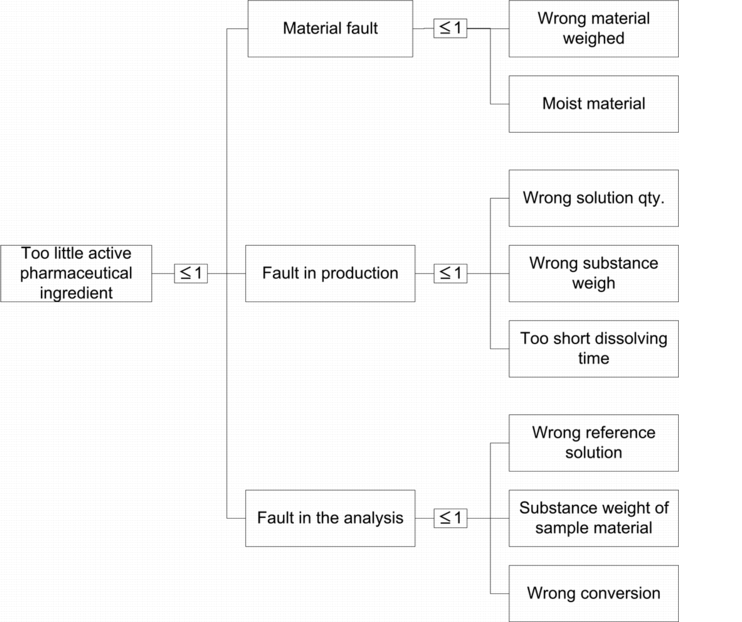
The fault tree can now be created. Starting from the undesirable event (top event), the events (if applicable via gates) are grouped together in terms of a "why-because" relationship. The fault tree ends when you arrive at the basic event. This status may take place more or less rapidly in the individual branches, so that each branch in a fault tree can be a different length. Figure 2 shows an example of an FTA
5 Advantages and disadvantages of an FTA
- All causes are displayed systematically.
- Important measures for minimising risk can already be derived at this stage.
- The FTA provides a valuable basis for "quantitative" evaluation of the risks, e.g. FMEA.
- Qualification aspects are defined at an early stage
- The method is comprehensive; potential faults are also recorded.
Disadvantages of an FTA
- Training is required before it can be carried out for the first time
- The availability of resources must be guaranteed.
|
Summary An FTA can be used to identify the dependencies and thus the actual cause of a fault or failure. The FTA can also be used together with an FMEA to establish preventative measures. For the fault under analysis, possible causes and their causes are collected until you arrive at the basic event. The possible causes are then used to derive measures for minimising risk. |
